Data for Pidgin
Raw Data
The raw data is available here.
- The file
joint_data.csvcontains all the data collected by IfdefRevolver. - The files
YYYY-MM-DD/all_functions.csvcontains static metrics of all the functions in the respective snapshot. - The files
YYYY-MM-DD/ABRes.csvcontains static metrics about preprocessor use of all functions in the respective snapshot. - The files
YYYY-MM-DD/function_change_hunks.csvcontains change metrics of all functions in the respective snapshot. - The files
YYYY-MM-DD/snapshot_commits.csvcontains hashes of the commits that the respective snapshot encompasses. - The results of the statistical tests for RQ1 are in
group_differences.csv - The results of the statistical tests for RQ2 are in
spearman.csv - The results of the statistical tests for RQ3 are in
logit-reg.csv(logistic regression results),logit-reg-std.csv(logistic regression results after standardization), andnb-reg.csv(negative binomial regression with the outcomes “number of commits” and “lines changes”).
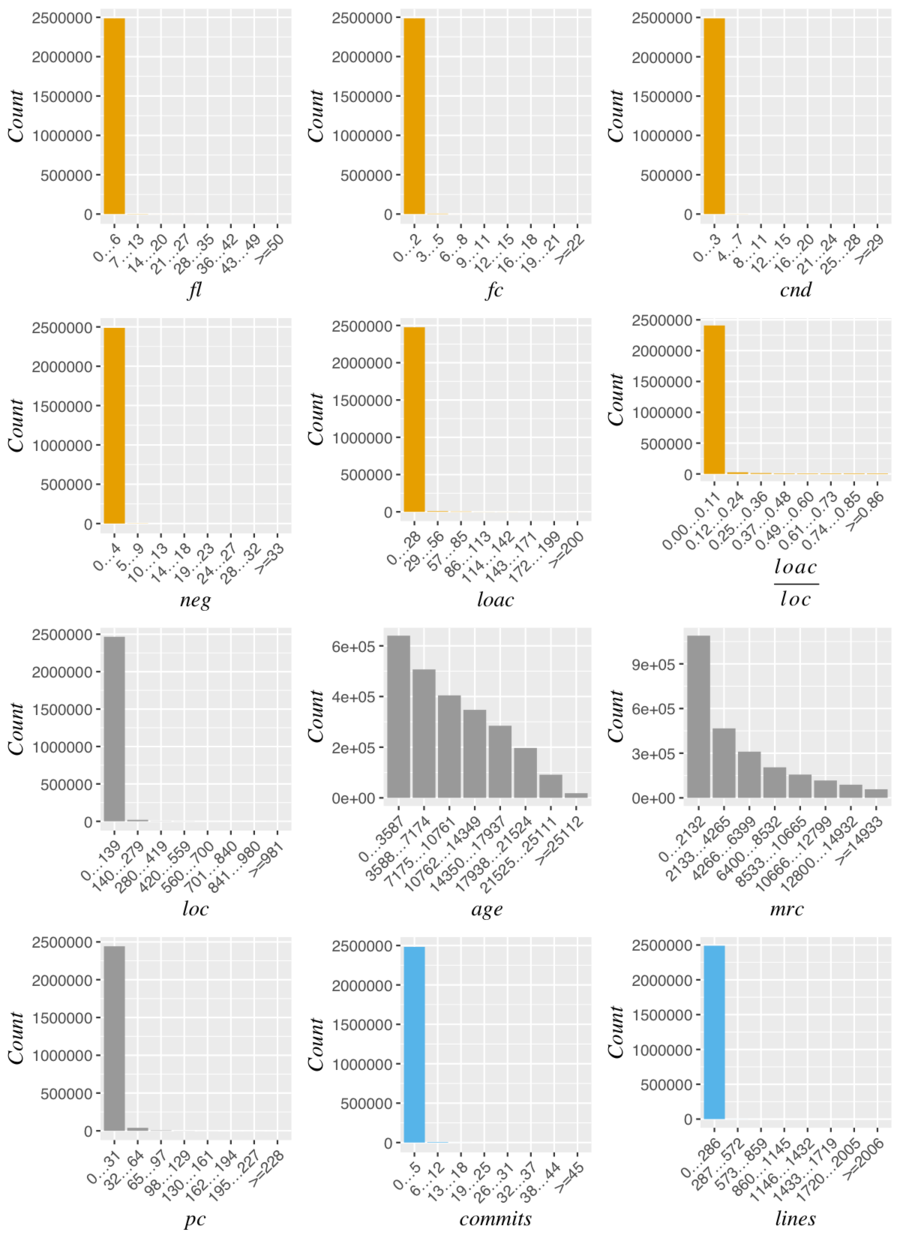
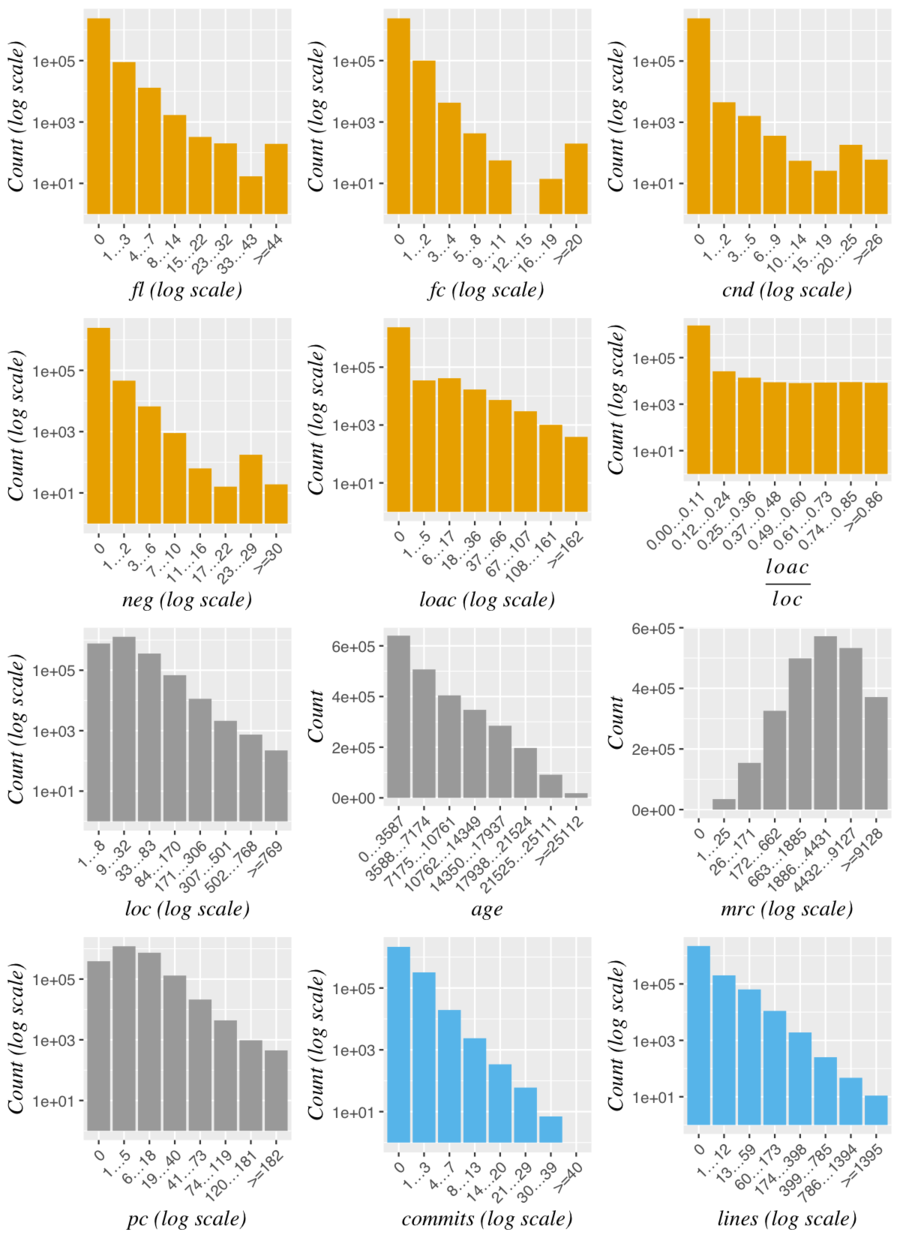
Distributions of Independent and Dependent Variables
The first picture visuzalizes the distributions of the variables without log transformations.
The second picture visuzalizes the distributions of the variables after log transformation of the x- and/or y-axis.
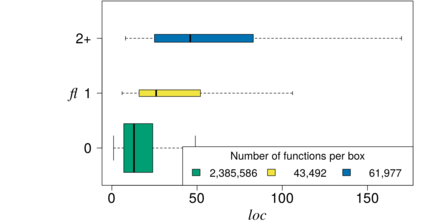
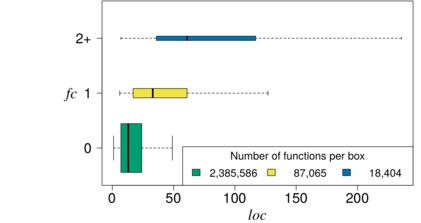
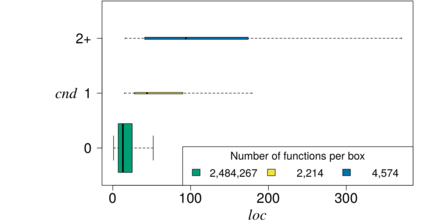
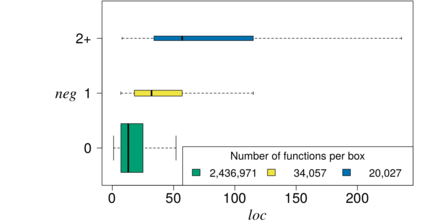
Relationship between Preprocessor Use and Function Size
The following picures visualize the relationshipt between preprocessor use and functions size.